Quantitative Growth
QUANTITATIVE GROWTH OVERVIEW
The ACT test is one of the most important tests my students will take. The ACT score is a critical component of college admissions, scholarships, and career opportunities. All my 11th grade students will take the official ACT in April and June. In preparation for the official ACT test, my students take previously released, real ACT tests at the end of each quarter of the school year, which KIPP network calls Interim ACTs (IA). The IAs are taken under standardized testing conditions, as students have no prior exposure to the questions, and are proctored by school administration. The purpose of the IAs is assess student mastery of the ACT standards, and project student ACT scores.
Interim ACT data is made available to me within a few weeks after the test date. I find IA data highly valuable because it provides me with a deeper understanding of student strengths, tendencies, and misconceptions. I analyze the data on a whole roster, general versus special education, and individual student level, so that I can push all my students towards earning their highest score on the next IA. My students and families are motivated and invested on the IAs and in our preparation for the ACT, because they can see the real-world opportunities created by higher ACT scores. Currently, my students have achieved 0.9 years of ACT growth within the first semester, and they are on track to achieve 1.9 years of growth by the end of the school year.
Please scroll down or click on the table of contents below to learn more about how my students achieved quantitative, dramatic academic growth on the ACT test.
TABLE OF CONTENTS
Overview of the ACT
ACT Sample Math Questions
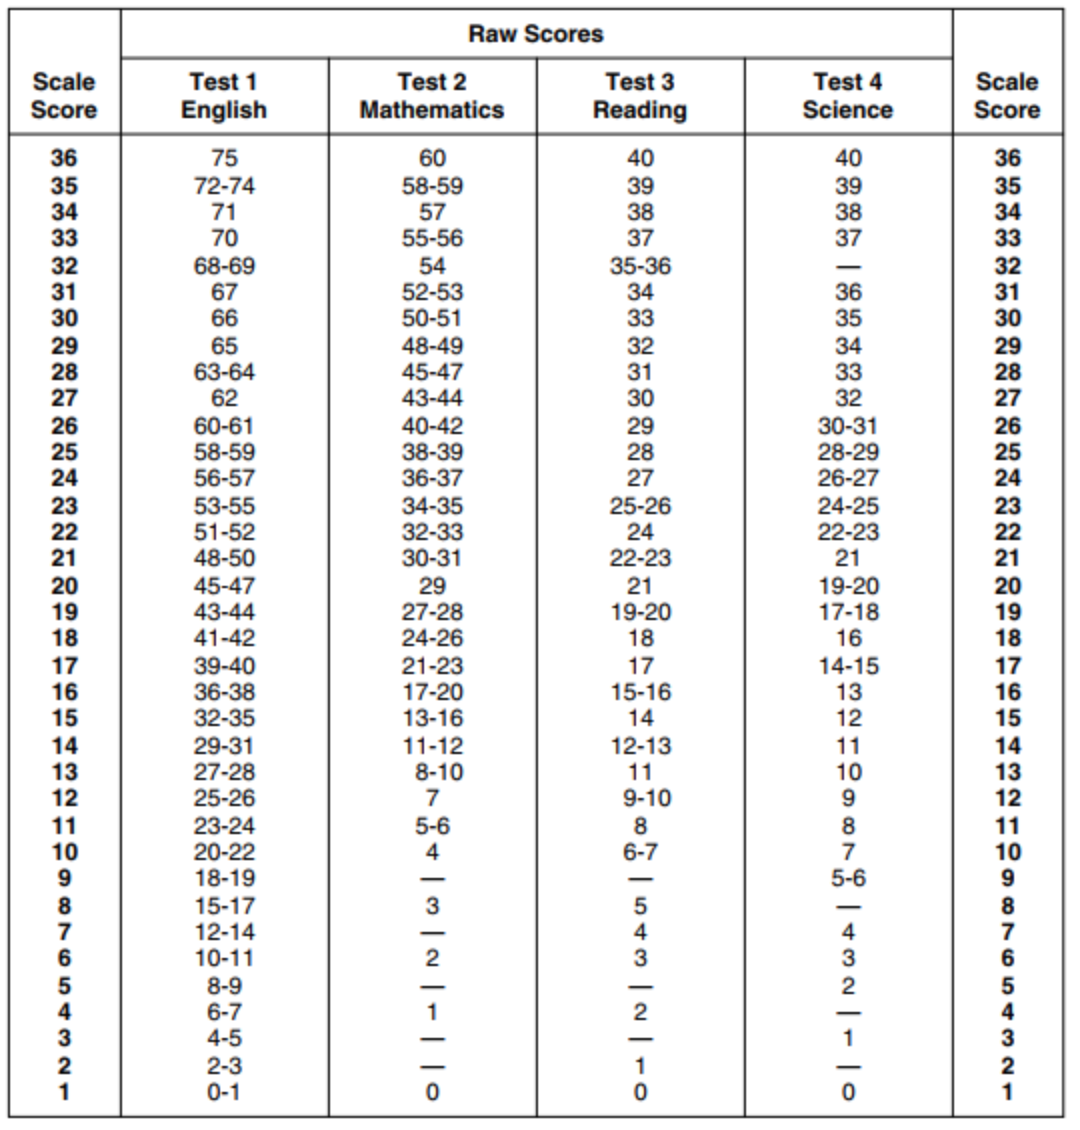
ACT Scoring Chart
Data and Analysis
Individual Examples of Dramatic Growth
Teacher Reflection
The ACT test is one of the most important tests my students will take. The ACT score is a critical component of college admissions, scholarships, and career opportunities. All my 11th grade students will take the official ACT in April and June. In preparation for the official ACT test, my students take previously released, real ACT tests at the end of each quarter of the school year, which KIPP network calls Interim ACTs (IA). The IAs are taken under standardized testing conditions, as students have no prior exposure to the questions, and are proctored by school administration. The purpose of the IAs is assess student mastery of the ACT standards, and project student ACT scores.
Interim ACT data is made available to me within a few weeks after the test date. I find IA data highly valuable because it provides me with a deeper understanding of student strengths, tendencies, and misconceptions. I analyze the data on a whole roster, general versus special education, and individual student level, so that I can push all my students towards earning their highest score on the next IA. My students and families are motivated and invested on the IAs and in our preparation for the ACT, because they can see the real-world opportunities created by higher ACT scores. Currently, my students have achieved 0.9 years of ACT growth within the first semester, and they are on track to achieve 1.9 years of growth by the end of the school year.
Please scroll down or click on the table of contents below to learn more about how my students achieved quantitative, dramatic academic growth on the ACT test.
TABLE OF CONTENTS
Overview of the ACT
ACT Sample Math Questions
ACT Scoring Chart
Data and Analysis
Individual Examples of Dramatic Growth
Teacher Reflection