Ms. Michelle Chang
  • About Me
  • About My Classroom
  • Teaching Philosophy
  • Teacher Growth
    • Assessment >
      • Algebra II Mastery
      • Year-Long Assessments
      • Student Engagement
    • Planning for Instruction >
      • Long-Term Planning
      • Unit Planning
      • Lesson Planning
    • Instructional Strategies >
      • Note-Taking Strategies
      • Learning Models
      • Student-Led Learning
  • Student Growth
    • Access >
      • Georgetown University Virtual Tour
      • Morgan State University Field Trip
      • Teen Parent Resources
    • Habits & Mindsets >
      • Metacognition
      • Managing Impulsivity
    • Advocacy >
      • The Economics of Social Media
      • International Educational Equity
    • Dramatic Academic Growth >
      • Quantitative Growth
      • Qualitative Growth

Lesson Planning

LESSON PLANNING OVERVIEW
In the final stage of planning for instruction, I create lesson plans. Because of backwards planning, I can use the long-term plan and unit plan to guide the creation of my lesson plans. I reference the long-term and unit plan to ensure that my lesson plan is aligned to standards and sequenced appropriately to build off prior learning and learners' interest. At this stage of planning, I can dive into exactly which strategies, accommodations, resources, and materials are best for objective mastery. I aim to meet the needs of all my diverse learners, so my lessons are differentiated. In addition, I plan my lessons to not only build students' academic knowledge, but also their cultural competence and critical consciousness.


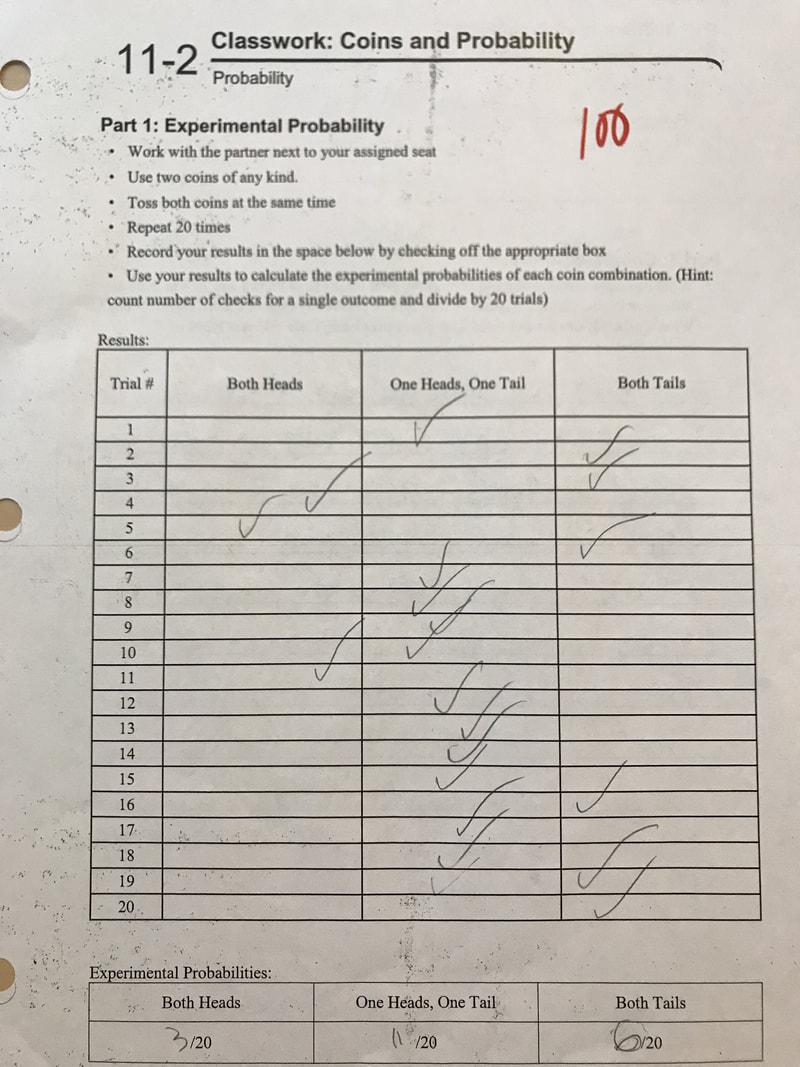
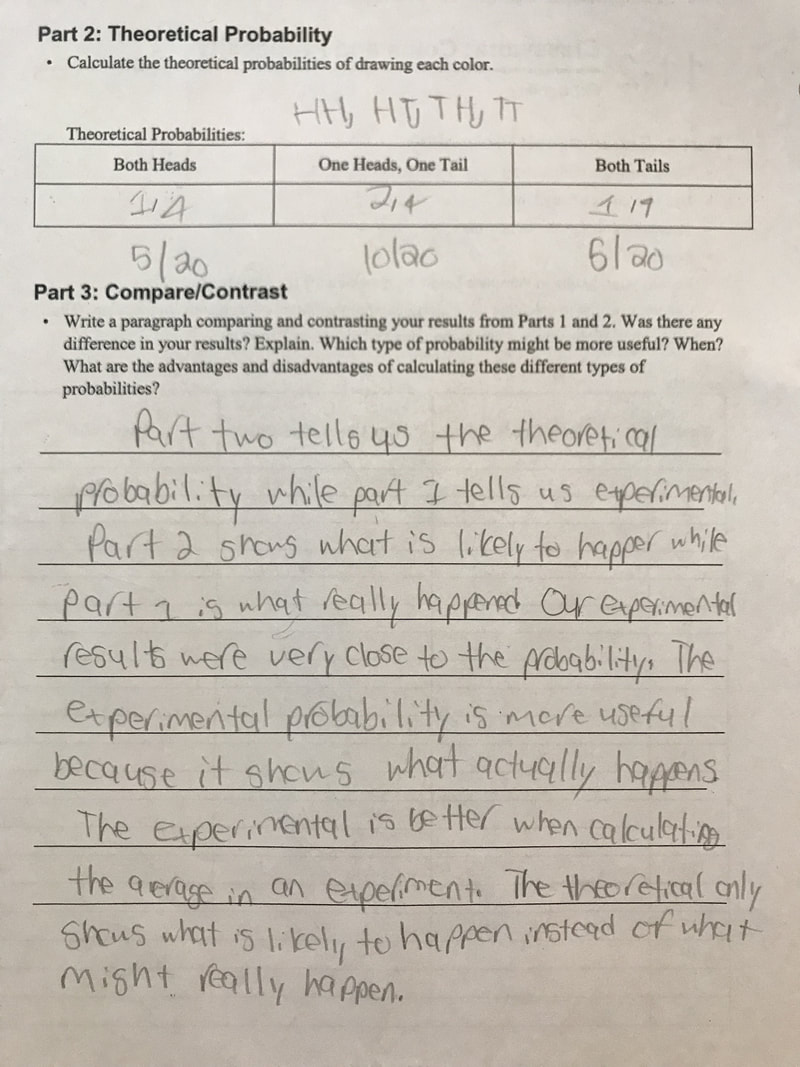
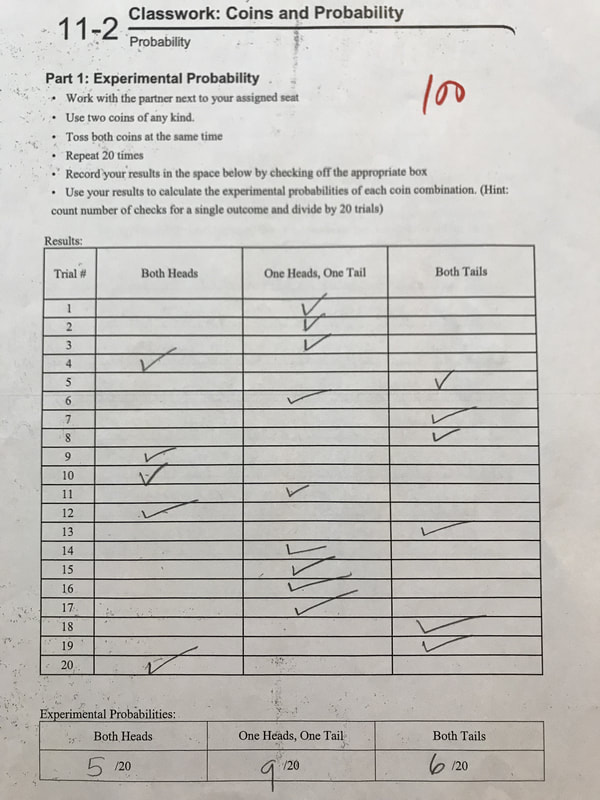
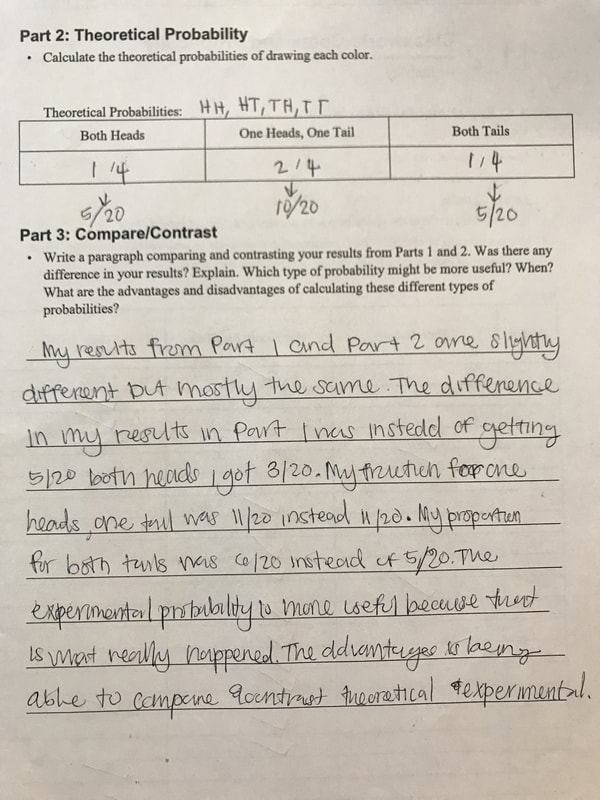
In the lesson showcased on this page, students build cultural competence and critical consciousness by learning about theoretical probability in baseball. Students will watch an engaging sports video about Sabermetrics. Many of students indicated on their beginning of the year survey that one of their top 3 hobbies is playing sports. The video on Sabermetrics will expose them to how statistics is used in sports, and future career opportunities in sports analytics. Students will also calculate the probability of pitching a “high-inside” in the strike zone, and see how changes to the dimensions of the strike zone affects the probability.

​Please scroll down or click on the table of contents below to learn more about my lesson plan, powerpoint, and project-based learning.


​TABLE OF CONTENTS
Lesson Plan
Lesson Powerpoint
Project-based Learning

Lesson Plan

 
The lesson plan sets the lesson vision and determines teaching methods. In the vision-setting process, I state the objectives, key points, and formative assessment. By the end of the lesson below, students will be able to calculate theoretical and experimental probability, and determine when to use each. When determining teaching methods, I collaborate with my co-teachers, and use a variety of resources such as Pearson's Algebra II Common Core, Teaching Tolerance, Better Lesson, and Eureka Math. For each part of the lesson, I outline teacher actions, student actions, time frame, and necessary materials. I aim to make all lessons a visual, auditory, and tactile learning experience. The lesson plan below involves an interactive Powerpoint, video, and technology-infused experiment. While teaching methods are different in every lesson, I keep the progression and behavioral expectations of all parts of the lesson the same. Thus, students experience a consistent classroom schedule.

As my students learn and develop uniquely, there are various forms of engagement that I incorporate into every lesson. During the do now and notes, my students and I practice call and response. All examples are scaffolded, and I draw from students' prior knowledge. Therefore, students can volunteer to walk through new material with me. In addition, I implement other checks that allow for less vocal students to participate, such as hand signals and individual white boards. During guided practice, students turn and talk to their desk partner, as they collaborate on solving problems. Student volunteers present their work on the front board, and other students explain and critique their work.

During independent practice, classwork is differentiated, and students are divided into groups A, B, and C based on their latest summative assessment score. For example, in the lesson plan below, students in group C are exempted from problems 18-21, as those are the challenge problems. Students in group C did not master the previous exam, so they work with my co-teacher to complete all odd-numbered problems, and low mastery objectives from the previous summative assessment. Students in group B showed partial mastery on the previous exam. Group B works on all problems in chronological order, as problems are ordered in difficulty. Students in group A mastered the previous exam. They are encouraged to work on the challenge problems first. I typically work with group A first, to guide them through their challenge problems, and then work with group B as they approach the more difficult problems towards the end of class.

To the Top

Lesson Powerpoint

 
Consistency is core to my classroom culture. For every lesson, I create a PowerPoint that includes the do now, homework check, introduction to new material, and guided practice. The PowerPoint format visually engages students with colorful charts, illustrations, and diagrams. The format of the PowerPoint and the student behavior expectations on each slide remain consistent throughout all my PowerPoints. I index all lesson materials such as my daily PowerPoint, classwork, and homework materials, so that they are easy to revise and email to absent students.

As students enter my classroom each day, they receive a paper copy of the PowerPoint in order to practice note-taking skills. Students are encouraged through positive narration to annotate and take additional notes on each slide. I frame the purpose of note-taking during presentations around the fact that students will need these skills in college. The PowerPoint is displayed on a white board, so I can interactively model all annotations and note-taking. In addition, I write step-by-step problem-solving processes on the white board for every problem in the do now and introduction to new material. Students also write down all mathematical thinking on their paper copy of the PowerPoint.

To the Top

Project-based Learning

 
After the introduction to experimental and theoretical probability through Sabermetrics, students will run their own experiment as part of guided practice. This activity puts students in the center of learning, as they will explore experimental and theoretical probability in pairs before reporting back to the whole class.

This lesson requires internet access to Google Apps and Spreadsheets. We will use Google Apps as an experiment tool and the Spreadsheet as a collaboration and analytics tool. This lesson reflects 21st century learning, for instead of using real coins and paper tallies, we are doing everything virtually. Google Apps and Spreadsheet are new trends in technology, so using this technology prepare students with the technical skills for college and many careers. While I do not have access to a class set of laptops, students will be using their phones to access technology.

In the first part of this lesson, students will be using their phones to “flip” a coin, using a Google application. Students will enter their data onto a class spreadsheet in Google Spreadsheets. I have learned how to create quick analytics in Google Spreadsheet so that students can see the running average for 2 heads, 1 head / tail, 2 tails, as they enter in the data. Students will also be able to see their data, versus the whole class data on a scatterplot. In the second part of the lesson, as a whole class, we will compare how partner student data varies from the class average. Students will come to a conclusion on the theoretical probabilities of each outcome. In the last part of the lesson, students will write a reflection comparing and contrasting experimental and theoretical probability. 

Below are examples of student work from the activity.
Picture
This student used his Google coin flip app to tally his experimental outcome.
Picture
The student understands how to calculate theoretical probability and experimental probability. He accurately states that experimental probability is "what really happened", while theoretical probability is "what is likely to happen." His thorough comprehension indicates that we can progress to the next objective.
Picture
This student used her Google coin flip app to tally her experimental outcome. The app produces different outcomes every time, so her results are different from the student above.
Picture
The student accurately calculates experimental and theoretical probability. In her reflection, she argues that experimental probability is more useful because it is "what really happened". She found the advantage to calculating both was the opportunity for comparison. Her thorough understanding indicates that we can progress to the next objective.
Back to Unit Planning
To the Top
Continue to Instructional Strategies
Proudly powered by Weebly
  • About Me
  • About My Classroom
  • Teaching Philosophy
  • Teacher Growth
    • Assessment >
      • Algebra II Mastery
      • Year-Long Assessments
      • Student Engagement
    • Planning for Instruction >
      • Long-Term Planning
      • Unit Planning
      • Lesson Planning
    • Instructional Strategies >
      • Note-Taking Strategies
      • Learning Models
      • Student-Led Learning
  • Student Growth
    • Access >
      • Georgetown University Virtual Tour
      • Morgan State University Field Trip
      • Teen Parent Resources
    • Habits & Mindsets >
      • Metacognition
      • Managing Impulsivity
    • Advocacy >
      • The Economics of Social Media
      • International Educational Equity
    • Dramatic Academic Growth >
      • Quantitative Growth
      • Qualitative Growth